Data. Technology. Possibility.

Complex data.
Clear possibilities.

We build dependable data platforms, Power BI reporting and software that helps organisations work better. Practical expertise, backed by a deep understanding of healthcare.

Expertise that works togetherPower BISQL Server & AzureBespoke software

From the foundations
to the bigger picture.

Consultancy · Development · Ongoing support

01 / Connect

Make your data
work together.

Connect your systems with SQL Server and Azure data solutions. Build dependable reporting foundations with clear definitions, data quality checks and traceable mappings.

Data engineering & management
  • Data integration, pipelines and warehousing
  • SQL Server, T-SQL and Azure SQL
  • Data quality and reconciliation
  • Metadata, definitions and source mappings
Explore data engineering
02 / Understand

See what
matters.

Make decisions with Power BI dashboards, executive scorecards and custom visualisations. Bring performance, pathways and geographic comparisons into focus.

Power BI & analytics
  • Semantic models and DAX calculations
  • Executive and operational reporting
  • Custom Deneb visuals and drillthrough
  • Pathway, conversion and geographic analysis
Explore Power BI & analytics
03 / Build

Tools shaped
around you.

Give your team tools that fit the way they work: reporting portals, configurable forms, request management and applications connected to your data.

Bespoke application development
  • Report libraries and discovery
  • Configurable forms and request workflows
  • Data dictionaries and exploration tools
  • Application modernisation and ongoing development
Explore software & portals

From information to action

A clearer view,
in practice.

Executive performance, complex pathways and geographic comparisons. Explore some of the questions our reporting and analytics can help you answer.

Illustrative examples with synthetic data, showing the types of reporting we develop.

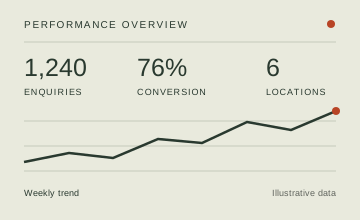
Illustrative scorecard with 1,240 enquiries, 76% conversion and a weekly trend, all using synthetic data.
01 / Performance

One view of performance.

Where do we need to focus?

Bring key measures, trends and comparisons together in an executive scorecard. Move from the headline to the detail behind it.

  • Shared KPI definitions
  • Performance against a target
  • Drillthrough to supporting detail
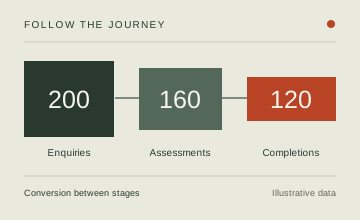
Illustrative journey from 200 enquiries to 160 assessments and 120 completions, using synthetic data.
02 / Pathways

Understand every stage.

Where does progress slow down?

Follow a referral, service or customer journey. Explore conversion between stages, waiting points and reasons for dropout.

  • Stage and cohort comparisons
  • Conversion and dropout analysis
  • Custom visuals for complex journeys
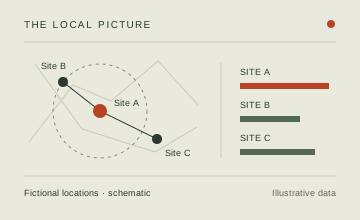
Illustrative schematic comparing three fictional locations, with Site A highlighted. Not a map of real places.
03 / Geography

See the local picture.

How do locations compare?

Explore site performance, catchments and proximity. Put geographic context alongside your measures to understand patterns across locations.

  • Site and regional comparisons
  • Distance and catchment analysis
  • Competitor and referral geography

How we work

Good technology
starts with
understanding.

We listen first, work with you and stay involved. The right solution starts with your needs.

Understand the challenge.

Start with your people, systems and decisions. For an existing reporting solution, we can review the models, calculations and user experience, then agree priorities and scope.

Build the right solution.

Connect the data, make the definitions clear and develop with the people who will use the result. Test and refine as the work takes shape.

Keep moving forward.

Make the work maintainable with documentation and handover. Agree the ongoing support and development your team needs.

Our healthcare expertise

Deep knowledge.
Wider possibilities.

We specialise in SUS, Payment by Results (PbR) and HRG grouping, alongside patient-level modelling, pathway analysis and operational reporting. We understand the detail behind the data and the questions healthcare teams need to answer.

That experience shapes our work across sectors: connect the right sources, make definitions clear and give people information they can use.

  • SUS
  • PbR & HRG grouping
  • Patient-level models
  • Pathway analytics
Explore our healthcare expertise

Client experience

Good work.
Lasting relationships.

Some of the organisations we’ve worked with, from NHS trusts to specialist consultancies.

  • 2020 DeliveryConsulting
  • Bedford HospitalNHS Trust
  • Kendall BluckBluck Kendall Consulting
  • Mersey CareNHS Trust
  • SEPTMental health NHS trust
  • Liverpool Heart and Chest HospitalNHS Foundation Trust
  • Countess of Chester HospitalNHS Foundation Trust
  • BalcroftResults-driven consulting
  • Blackpool Teaching HospitalsNHS Foundation Trust

In our clients’ words.

Mersey Care NHS Trust has used SAM Visualise & SAM Intelligence Hub to deliver our new data sharing project with the local health economy, and the benefits have been numerous. The dashboard is fast, stylish and incredibly easy to use; internally we have been able to automate a number of datasets into one simple report which saves time and man power, whilst also offering a single version of the truth to all users. Externally our commissioners now have a tool to provide them with up-to-date information, better assisting them with making business decisions. We are delighted with the tool and cannot wait to expand its usefulness further!

Chris HannahEIS Manager, MerseyCare NHS Trust

ClikHealth Solutions have worked successfully with Bedford Hospital on an implementation of QlikView to provide much better business intelligence on Accident & Emergency, Clinical Governance, Inpatients, Outpatients, Readmissions and Pathology. The SAM template provides a consistent look and feel between the datasets whilst allowing users to drill down to underlying data details. I have been impressed in ClikHealth's in-depth knowledge of NHS data and their level of assistance in getting users involved in looking at their own data. I would not hesitate to recommend them in this work to anyone invoved in Healthcare.

Mark AustinAssociate Director of Business Intelligence, Bedford Hospitals NHS Trust

We have worked with ClikHealth on several key projects that delivered significant service improvement across health organisations. The analytics and in-depth knowledge of the subject matter that ClikHealth was able to contribute, played a vital part in these successful projects

Matthew BluckManaging Director, Bluck Kendall Consulting

The people behind ClikHealth

A team to
think with.

Data engineering, technology, design and delivery. Different skills, working together around your needs.

  • Kieran Wright

    Managing Director

  • David Inman

    Technical Director

  • Steve Bayley

    Data Engineer

  • Sarah Trayers

    General Manager

  • Angela Young

    Web & Graphic Design

Let’s make more
of your data.

Tell us what you need to understand, improve or build. Whether you’re reviewing existing Power BI reports, connecting data or planning a new application, we’ll discuss a practical starting point and agree the scope with you.

info@clikhealthsolutions.co.uk